Branding
May 21, 2026

Here's the design challenge nobody prepares you for: it's not making things look good. It's making complexity legible.
A marketing site has one job — get someone interested. A dashboard has a completely different one: help someone who already cares deeply make a decision from a pile of numbers.
Dashboard UI design done poorly gives you the kind of screen that looks impressive in a demo and confusing in daily use. A wall of charts. Numbers without context. Filters that don't do what users expect. Everything the same visual weight, so nothing actually stands out.
Done well, a dashboard tells a story. The user knows what matters, why it matters, and what to do next — ideally in under five seconds.
That's the target. Here's how to get there.
Before you draw a single component, answer this: what decision will the user make after looking at this dashboard?
It sounds simple. It's not. Most dashboards get built around "what data do we have?" instead of "what decision does this support?" The result is screens that display a lot without communicating anything.
The best SaaS dashboard design starts from the user's mental model, not the database schema. A sales manager looking at a pipeline dashboard isn't asking "what is our data?" — they're asking "which deals need my attention right now?" A product team looking at engagement metrics is asking "is anything broken, and if so, where?"
Before you design a single chart, write down the top three questions a user needs to answer in a typical visit. Those questions are your hierarchy. The answers to question one go in the prime zone. Questions two and three come next. Everything else is secondary or filterable.
Eye-tracking research shows users scan dashboards in an F-pattern: top to bottom, left to right, with decreasing attention as they move down and right. The top-left is prime real estate. The bottom-right barely gets read.
This has a direct implication for your layout. Your most important metrics — the numbers that answer the user's first question — belong at the top. Not tucked in a sidebar, not buried after a header with three dropdowns. Top rail, high contrast, immediately scannable.
The analytics dashboard design pattern that works best for most SaaS products:
Top rail: Key performance indicators. 3-5 numbers max. Big, bold, with directional context (is this up or down vs. the relevant benchmark?). Users should be able to absorb these in about two seconds.
Middle section: The charts that explain the KPIs. If revenue is up 18%, the middle section should show where that came from. If churn is elevated, it should show the cohort breakdown.
Lower section: Detail tables, segmentation, filterable breakdowns. This is where users go to investigate, not to get oriented.
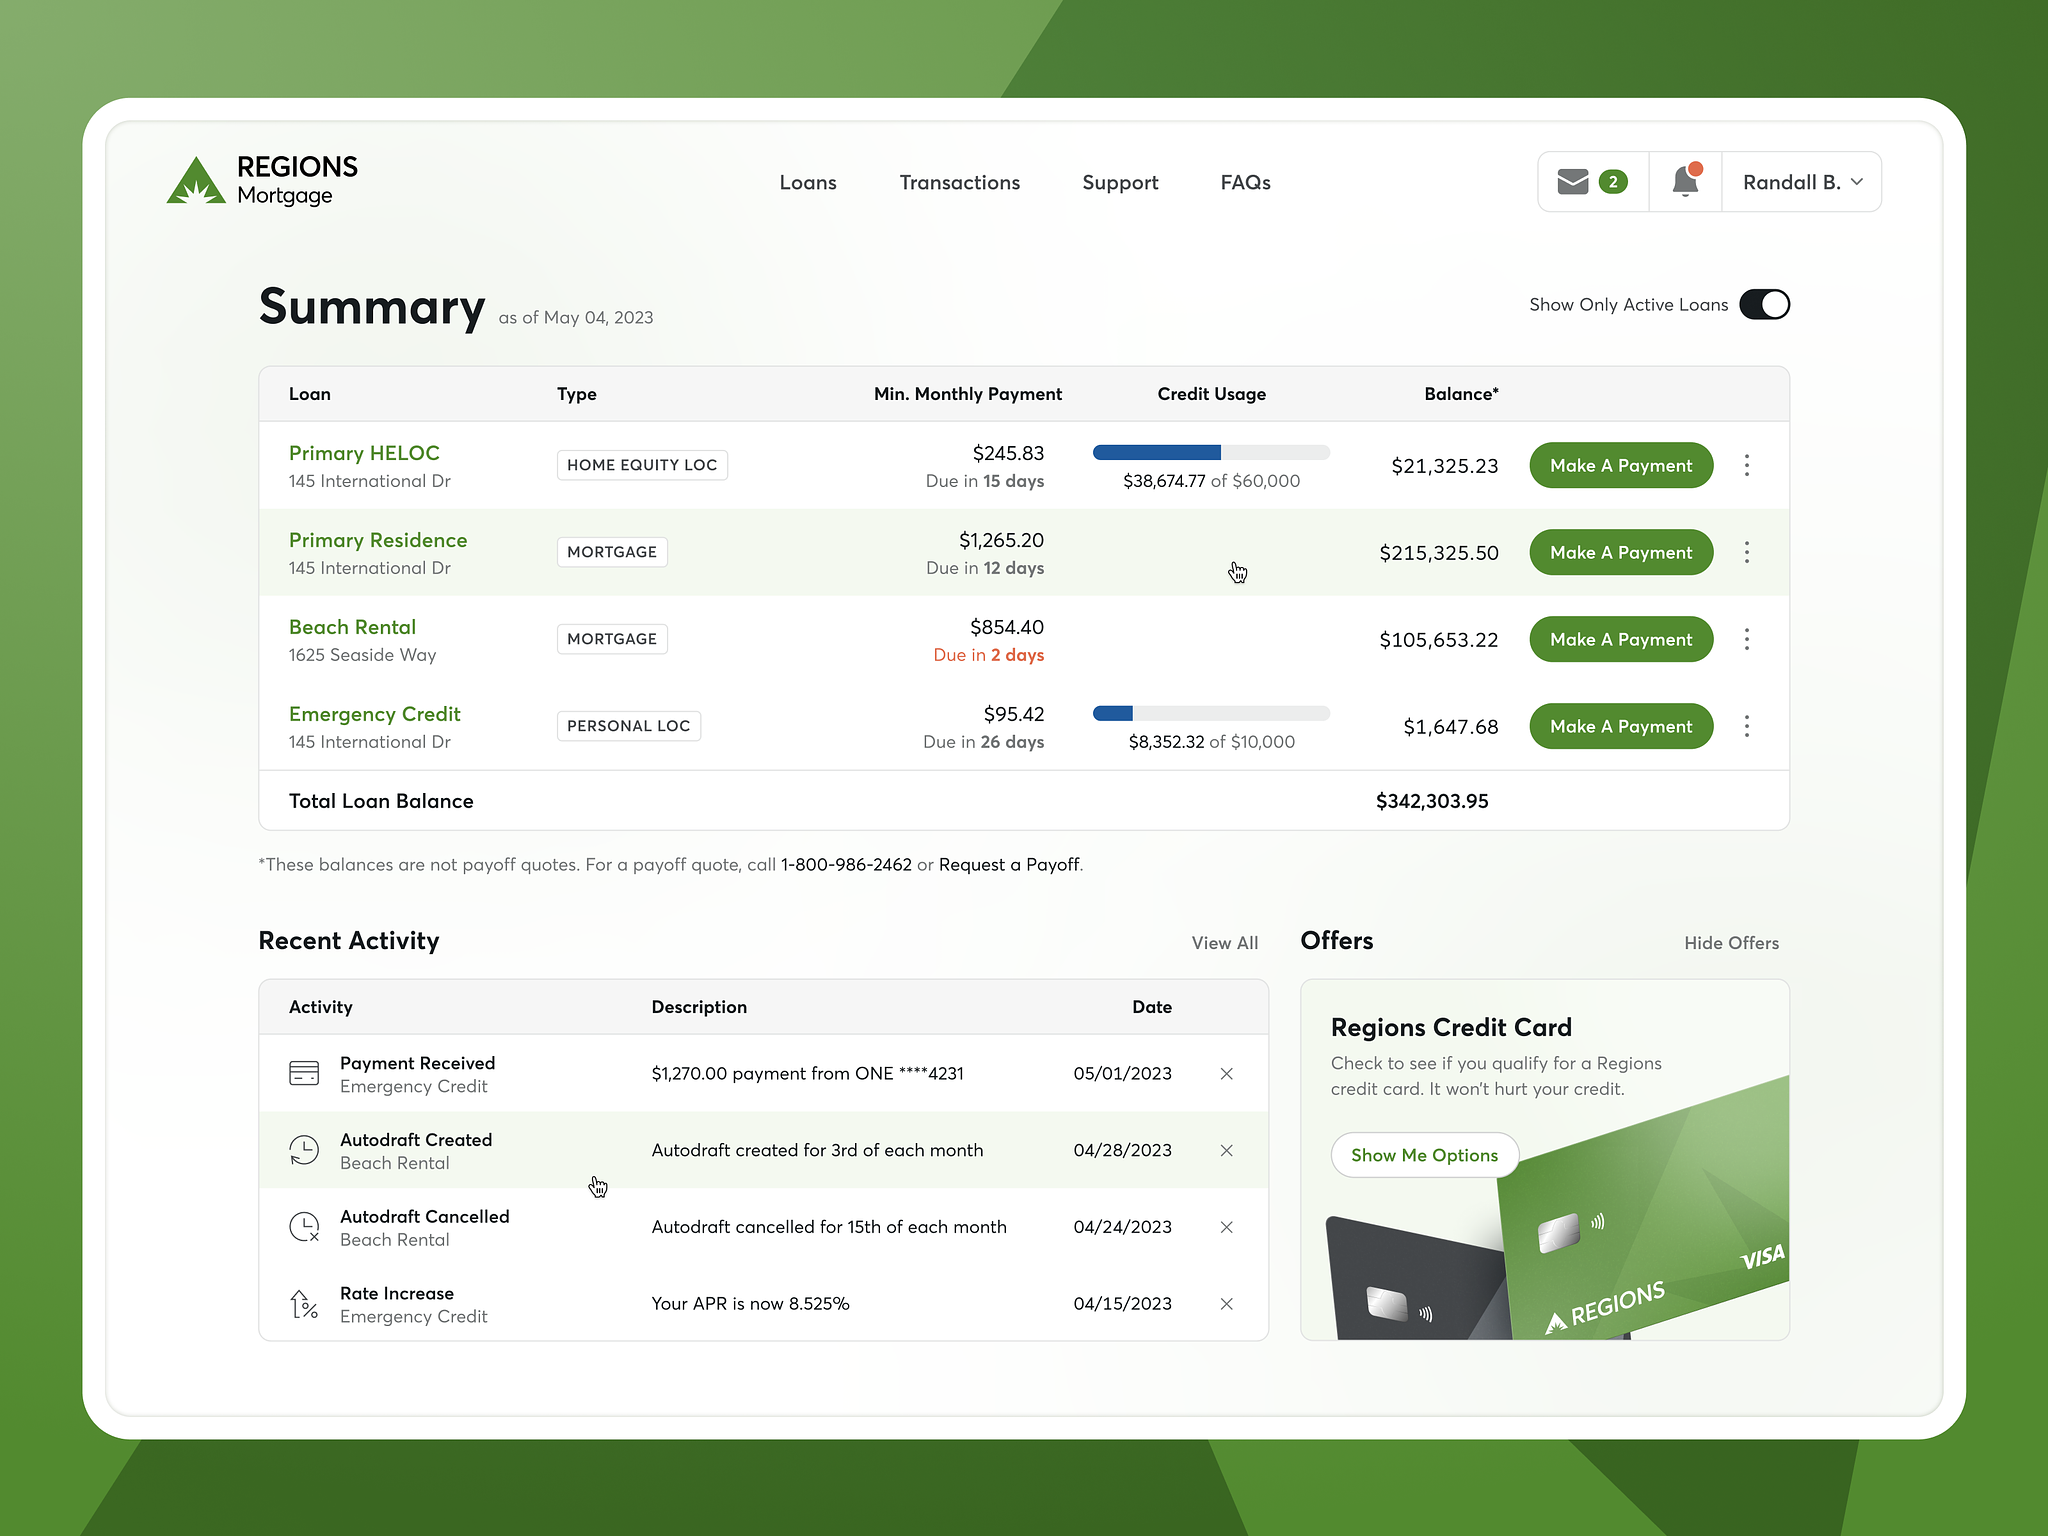
Notice the structure: the most critical numbers are immediately visible at the top, the charts provide context, and the details are accessible without competing for attention.
Hierarchy in a dashboard isn't just about position — it's about visual weight. Every design decision (size, color, contrast, whitespace) tells the user's eye what matters.
A few rules that hold across almost every data dashboard UX:
One highlight color, used consistently. Pick a single accent color (your brand primary, typically) and use it exclusively for "this is the number/element that matters most right now." When everything is highlighted, nothing is. Reserve your signal color for signals.
Typography size correlates with importance. A KPI number should be noticeably larger than its label, which should be noticeably larger than a footnote. The visual scale tells the story before the user reads a word.
Whitespace is a design element, not wasted space. Cramming more data onto a screen doesn't make a dashboard more powerful. It makes it more stressful to use. Generous whitespace between sections helps the eye understand what belongs together.
Don't use lines to separate groups — use space. This is a nuanced one, but it matters. Horizontal rules feel like walls. Whitespace creates breathing room. When you have a lot of data, white space groups better than dividers.
Most dashboard UI design failures aren't about missing features — they're about wrong chart types. Here's the quick guide:
Line charts are for trends over time. If someone asks "how has X changed?" — line chart.
Bar charts are for categorical comparisons. "Which channel drove the most conversions?" — bar chart.
Donut/pie charts are for part-to-whole relationships, but only with 3-5 categories max. More than that and the slices become meaningless slivers. Use a ranked bar chart instead.
Heatmaps are for high-density pattern recognition. "When are users most active?" — heatmap.
Tables are for precision. When the user needs the exact number, not the approximate trend — table.
The rule: use the simplest chart that answers the question. Complexity in chart form is almost always a distraction from the insight.
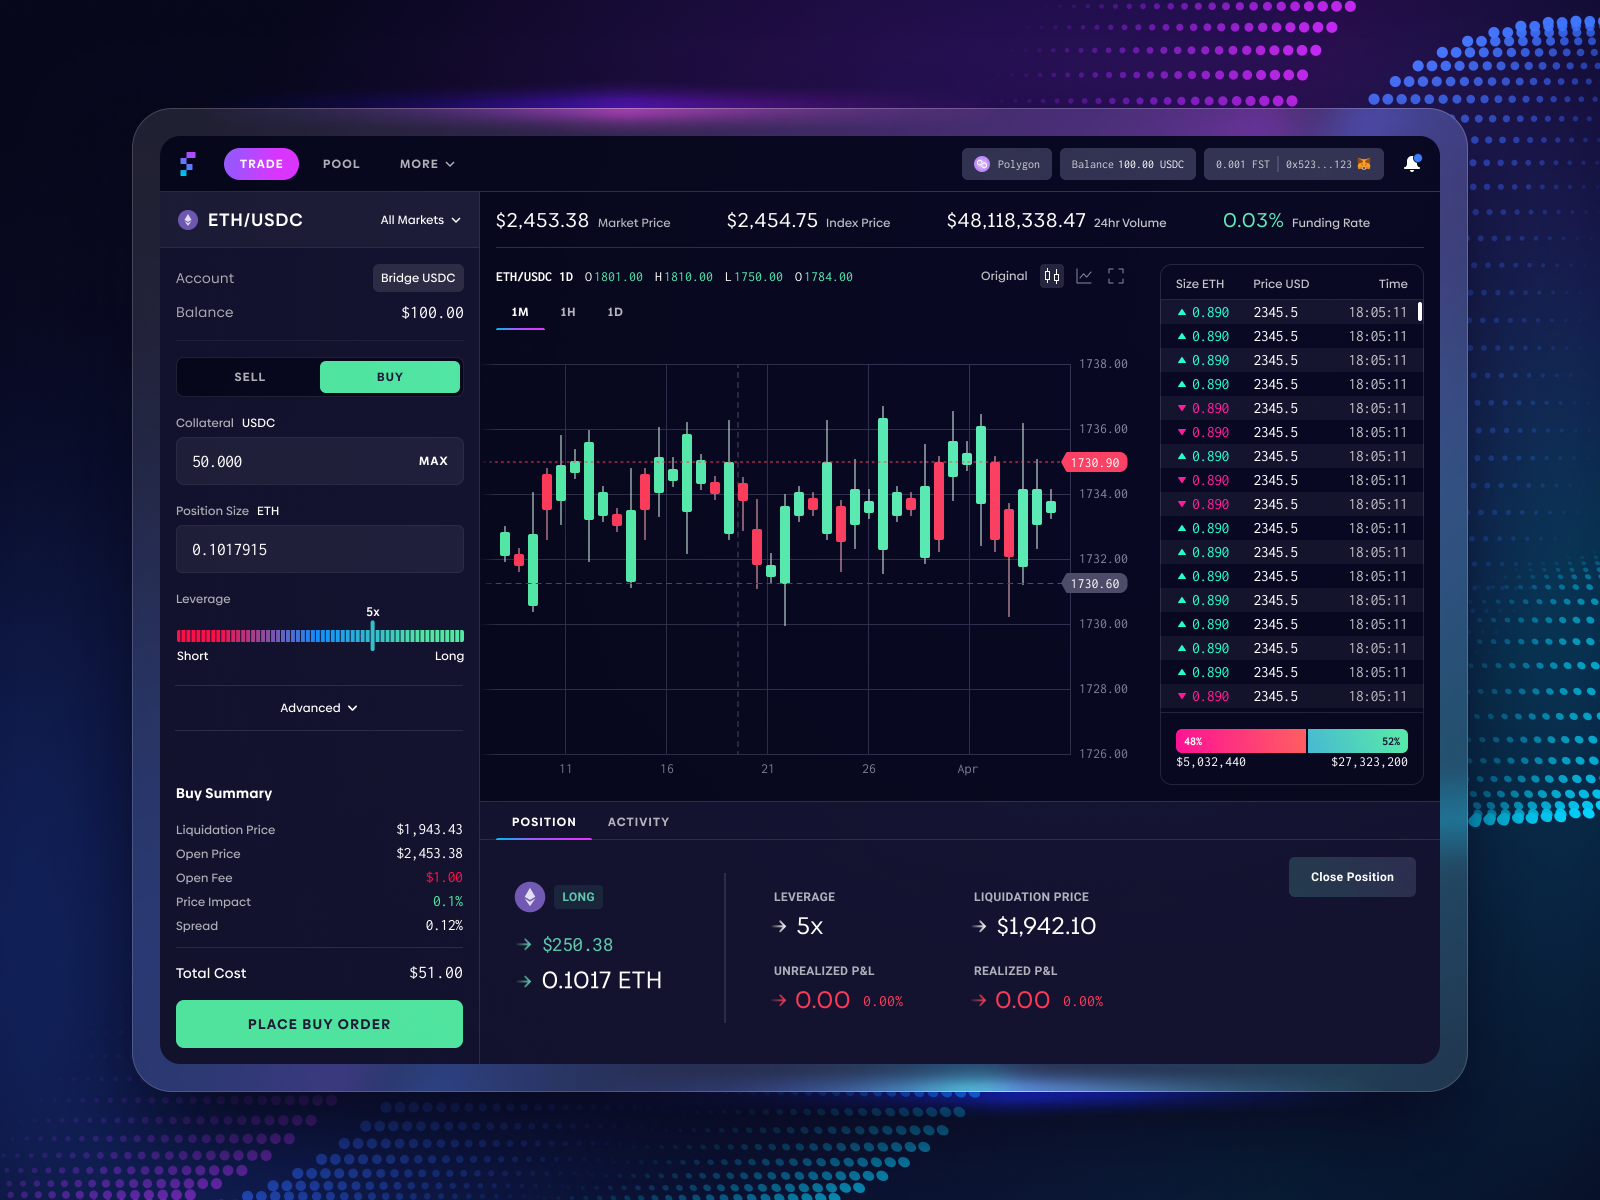
This is what intentional chart selection looks like — each visualization was chosen for the type of data it represents, not for visual variety.
Color in a dashboard should communicate meaning, not decorate. Assign it stable, consistent roles:
The biggest mistake: using your full brand palette across the chart colors because they're "on-brand." In a dashboard, a rainbow of colors looks chaotic and implies that every line/bar is equally important. Restrict your chart palette to 4-6 distinguishable colors at most.
Accessibility matters here too. Roughly 8% of men have some form of color vision deficiency. Don't rely solely on red/green for status — use icons, patterns, or text labels alongside color to ensure the meaning is accessible.
Mobile-first isn't always the right approach for complex data dashboards — the majority of usage is still desktop for most B2B products. But assuming mobile will never matter is a mistake you'll pay for later.
Design your dashboard hierarchy for desktop first, then think hard about which KPIs need to be accessible on mobile. The answer is usually: just the top-rail metrics. A mobile user checking a dashboard on their phone doesn't need the full breakdown — they need to know if the number is good or not.
Build a mobile view that surfaces the 3-5 most critical KPIs cleanly. Everything else can be "tap to expand" or redirected to desktop. That's a better experience than a compressed desktop layout that's illegible at 375px wide.
Here's a design problem that's often overlooked in analytics dashboard design: perceived performance. Even if your queries are fast, a dashboard that feels slow is a dashboard people avoid.
Design for the loading state. Use skeleton screens instead of spinners — they set expectations and feel faster. Load critical KPIs first, then charts, then detail tables. Use optimistic UI where you can (show a cached version while refreshing in the background).
Users are surprisingly forgiving of actual latency when the design communicates that something is happening. The experience of "this is loading" feels better than "is this frozen?"
Most data-heavy products don't need a complete redesign — they need a systematic pass through hierarchy, chart selection, and color strategy. That work, done well, transforms a confusing screen into one that actually gets used.
This is exactly where a design subscription earns its value. Instead of a one-time agency engagement that wraps up before the product evolves, you get continuous iteration — senior designers working through your dashboard screen by screen, with unlimited requests at a flat monthly rate and ~2 business day turnaround.
If your data product deserves better UX, let's talk about what a dashboard overhaul would look like with Jamm. Great dashboard UI design isn't about showing everything — it's about showing the right things in the right order with the right visual weight. Users who can answer their key questions in under five seconds are users who trust your product. Trust is what turns a tool into a habit.
Design your dashboard the way you'd want to read a report: the headline first, then the supporting story, then the detail. That's it. That's the whole framework.
See Jamm's plans and find the right tier for your team.
Hire a team of top level professionals for less money than hiring a single designer. Stupid simple design subscription service to level-up your business!
Looking forward to potentially working with ya ✌️

